Invented a century ago, GDP was never meant to fill as many roles as it does today. A new measure of well-being, GDP-B, promises a much clearer picture of where value emerges in our changing economy.
There are several ways we can describe the value of Google Search: by the number of daily queries it fields, the vast quantity of content it contains, the myriad ways it makes life easier. Alternatively, its value is reflected in the fact that, according to a new study, most people would forgo meeting their friends in person for a month before they would give up the service.
And it costs nothing to use.
“There are lots of amazing goods with zero price these days: apps on our phones, Wikipedia, ChatGPT,” says Erik Brynjolfsson, a professor of economics at Stanford and director of the Stanford Digital Economy Lab, a center within the Stanford Institute for Human-Centered AI (HAI). And yet all of this free stuff doesn’t register in the pulse of our economy; it’s not captured by GDP. “So we’re consuming a lot of free digital things and not doing a good job measuring it.”
A new project spearheaded by Brynjolfsson and Carnegie Mellon assistant professor Avinash Collis is crafting a tool for measuring the size and value of our increasingly digital economy. Called GDP-B — the “B” stands for “benefit” — the basic hope is to understand how much value something like Google creates. Early estimates from the work suggest that trillions of dollars of value from digital goods are currently missing in discussions of the U.S. economy, to say nothing of economies around the world.
Measuring well-being, not just production
Nobel-winning economist Paul Samuelson called GDP “among the great inventions of the twentieth century.” It offers a pithy measure of an economy’s production. But it has limits. As noted above, it overlooks the economic value of most free digital goods. It also conflates the production of beneficial goods, like new wind turbines and schools, with the production that’s connected to houses destroyed by wildfire or people sentenced to prison.
“GDP was never meant to measure well-being,” says Collis. “And yet, because we lack other numbers, economists, policymakers — almost everyone — have defaulted to GDP as a proxy for our general welfare.”
GDP-B is designed to address these shortcomings. A new paper by Brynjolfsson, Collis, Stanford postdoctoral scholar Jae Joon Lee, and several collaborators from Meta offers a proof-of-concept by outlining how GDP-B can be measured and interpreted.
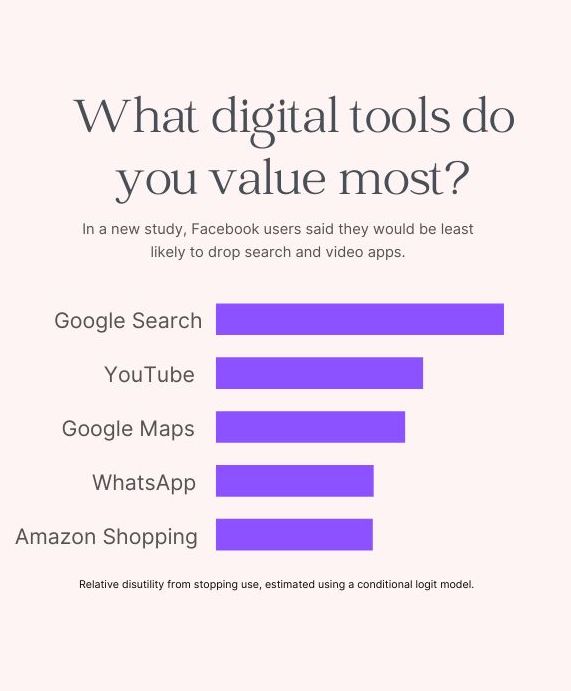
The researchers ran an online survey of nearly 40,000 people across 13 countries. Participants were first asked to rank a set of online goods from those they value most to those they value least. The full set of goods included Facebook, Twitter, Instagram, WhatsApp, Snapchat, TikTok, Google Search, Google Maps, YouTube, and Amazon Shopping. This provided information on the comparative value of each.
They next asked participants if they would be willing to stop using Facebook for a month in exchange for three randomly chosen dollar amounts between $5 and $100. “By seeing how many people accept the offer at each price point, we get a rough sense of its value for a representative group of people,” Brynjolfsson says. “If someone won’t give it up for five dollars but will for ten, then we know that the value of that good — its benefit to the consumer — is somewhere between those two.”
Using Facebook as a benchmark, the researchers were able to extrapolate the relative value of the other nine goods, captured in the first phase of the survey.
Uncovering trillions in missing value
Most fundamentally, GDP-B reveals that these 10 goods alone generate more than $2.5 trillion in annual consumer welfare across the 13 countries. This is roughly equivalent to 6 percent of their combined GDP.
Of particular interest, says Collis, was how much of this value flows to consumers. In the case of, say, breakfast cereal, a person may pay $4 for a box but be willing to pay $8; the company gets half the value and the consumer the other half. When it comes to most digital goods, this ratio tips much more favorably toward the consumer.
“Google Search may make 10 or 20 dollars a year from me, but I would say I get thousands of dollars of value from the product,” Collis says. “I can’t imagine living without it.”
“We need a metrics revolution.”
A clearer articulation of an economy’s topography is one of GDP-B’s great prospects. “In the U.S., Congress and policymakers have to make decisions about how to allocate budget dollars, how to spread R&D money or offer grants, and these decisions are often rooted in ideas about how the economy creates value,” Brynjolfsson says. “If we have the wrong measures, then we come to the wrong conclusions.”
Over the next few years, the researchers hope to expand the number of goods they’re looking at — digital and non-digital — from 10 to several thousand. This effort, Brynjolfsson suggests, could create a representative sample of the U.S. economy, giving a far more granular view into how much value different sectors create, and in what way.
GDP-B also has the potential to measure two types of good that elude the reach of traditional GDP. First, non-market items, like clean water, education, or infrastructure. “Having a nice park in a big city creates a lot of value,” Collis says. “But how much?” With the GDP-B survey methodology, governments could start attaching better numbers to historically vague domains.
Second, GDP-B can be used to define the negative value of something, like air pollution: How much would people pay to not have polluted air?
“There is a massive need for better data about how the economy is changing, how people are faring in it, and what kind of policy decisions will lead to better outcomes for more people,” says Christie Ko, executive director of the Stanford Digital Economy Lab. “The tools we have now give us poorer and poorer insight as time goes on. We need a metrics revolution to actually understand where and how progress is taking shape and how to wield this for the benefit of all.”
It’s impossible to fully grasp how robotics is changing manufacturing in the United States without a complete understanding of where those robots are. Now, new research is providing a snapshot.
And here’s why that’s important: Robotics is what’s known as a general-purpose technology—just like computers, the internet, and electricity—that has the potential to make a fundamental difference in how entire economies operate. In short, robots present an opportunity to transform the manufacturing industry to reach new levels of productivity and growth.
But the first step in maximizing that potential is understanding how the technology is used. “We’re still in the early stages of understanding what’s driving robot adoption,” said Erik Brynjolfsson, director of the Stanford Digital Economy Lab and senior fellow at the Stanford Institute for Human-Centered AI (HAI). “It’s important to have data about where they are and also where they aren’t, and what their other characteristics are.”
Finding the robot hubs
Brynjolfsson is the co-author of a new paper on robotics adoption, along with researchers J. Frank Li, Cathy Buffington, Nathan Goldschlag, Javier Miranda, and Robert Seamans. In “The Characteristics and Geographic Distribution of Robot Hubs in US Manufacturing Establishments,” the team sourced responses from the US Census Bureau’s Annual Survey of Manufacturers to examine which manufacturers use robotics, where the robots are, and how establishments are using them. (A shorter version of the paper, “Robot Hubs: The Skewed Distribution of Robots in US Manufacturing,” is published in AEA Papers and Proceedings 2023.)
“Before we answer all those other questions about productivity and performance and wages, you need to know where the robots are first,” Brynjolfsson said. “For now, the striking finding was how concentrated the robots are.”
More than any other factor, the researchers found that a business is more likely to employ robotics if other establishments in its region report they also use them. In the paper, these concentrated regions of robotics use are called “robot hubs.”
The team ranked regions by the number of robots used in manufacturing, which revealed that robots are highly concentrated in the top 10% of robot-dense areas—and the bottom 50% of regions had almost none. Survey data showed that the top five states with the highest robot adoption share by establishments were Iowa, Michigan, Kansas, Wisconsin, and Minnesota.
The paper also identifies several trends associated with robot hubs, including the presence of “robot integrators,” which are businesses that assist in acquiring and installing robots. Another correlation was a higher share of union membership. Those patterns on their own, however, don’t fully illuminate why a robot hub develops.
“The concentration of robot hubs is a function of several different things, such as the type of manufacturing these firms do, the education of the workforce, the size of the establishments, but it’s also sort of an unexplained dark matter, and that seems important as well,” Brynjolfsson explained. “Something about these environments makes it so that companies are more likely to use robots. A big part of future research will be to find out why that is.”
The advantage of census data
Past attempts to generate insight into robot adoption faced challenges, such as selection bias, inherent to the research process. For example, if researchers mailed out surveys or called manufacturers directly, potential respondents might not have picked up the phone. Or a manufacturer might assume that the survey had nothing to do with them and not mail their response back.
Of course, that assumption would be wrong. To fully and accurately understand the spread of robotics throughout the manufacturing industry, it’s vital to get accurate input from a representative set of establishments.
“There’s never been any careful data gathering on where robots are in America,” said J. Frank Li, a postdoctoral fellow at the Stanford Digital Economy Lab and one of the study’s authors. “There have been plenty of different kinds of bits and pieces that people gathered, but now for the first time, we worked with the US Census to gather some really detailed data on where robots actually are.”
In addition to counting people, the US Census Bureau conducts regular studies into trends and demographics throughout the economy. The Annual Survey of Manufacturers (ASM) was one of these—a set of questions designed to understand the current state of the manufacturing industry across several dimensions.
Since responding to the ASM is a legal requirement, responses don’t suffer from the same selection bias as non-mandatory surveys do. This enabled the team to gain unprecedented insight into the use of robots, confident that responses accurately reflected the nature of the entire manufacturing industry. The researchers developed their questions in 2017, which were included in the surveys for 2018–2020. The findings in the paper are based on 2018 data.
Brynjolfsson noted that he was impressed by the bureau’s process in developing the survey. “When a survey is required by law, you don’t want it to be cluttered up with anything time-wasting, so they did over a year of testing,” he said. “That process was an eye-opener for me, and I think it led to a survey that’s far and away the most representative of the industry, thanks to the Census. Otherwise, the data would have been way too scattered.”
Director, Stanford Digital Economy Lab
Laying the foundation
The researchers’ findings weren’t limited to solely identifying robot hubs, though. Data from the ASM also included information on the size and age of surveyed establishments and their workforces.
From this data, the researchers found that higher robotics use correlated with higher capital expenditures, particularly in information technology. The research suggests that companies willing to pay the price for robots are also more likely to spend more on other innovations and improvements, leading to enhanced automation and digitalization.
That kind of investment creates a spillover effect throughout surrounding local economies, just like the manufacturing output of the robots does. If the use and integration of robots creates better economic outcomes, then a stark divide between robot hubs and everywhere else could challenge overall growth.
Brynjolfsson raises this possible divide as a legitimate concern. “Having robots so concentrated could lead to a separation, where some manufacturing becomes much more high-tech and robust, and other parts get left behind—so it’s valuable to understand what drives the adoption and, ultimately, the diffusion of robots,” he said. “If we want not just productivity, but widely shared productivity, we need to have robots in places where right now they’re not as common.”
Understanding why companies are adopting robots in certain areas and not others will help guide future development throughout the manufacturing industry. Researchers, data agencies, policymakers, and industry stakeholders can all leverage the paper’s insights to work toward a more balanced and inclusive deployment of robotics.
The research team realizes that their work is just the beginning of a long line of research into understanding the impact of robotics in manufacturing. The authors propose several avenues that future researchers could pursue—one looks into the relationship between robot hubs and international trade, while another explores the link between robot adoption and other investments. “Our hope is that the patterns in the data that we document in our paper spark further research in this area that is of use to scholars, practitioners, and policymakers,” the researchers wrote.
Future researchers can also better understand the advantages and obstacles of robotics in manufacturing by examining the influence of robots on productivity and wages in manufacturing establishments. A more collaborative environment will make it easier to enable economic growth and tech advancement in the manufacturing sector—and beyond.
“Our examination of the cross-sectional data indicates that robot adoption is positively associated with the share of production workers but negatively associated with earnings per worker,” said Li. “However, what we can say about causality and the mechanism behind our findings is still limited without longitudinal data and exogenous shocks. I expect that as new waves of survey data become accessible, there will be an increase in research exploring the impact of robots on the US manufacturing sector.”
Any opinions and conclusions expressed herein are those of the authors and do not represent the views of the U.S. Census Bureau. Disclosure review numbers CBDRB-FY22-ESMD011-003, CBDRB-FY23-ESMD011-003, CBDRB-FY22-192, and CBDRB-FY23-ESMD011-004 (DMS# 7508509). We are grateful to the Hewlett Foundation, Kauffman Foundation, National Science Foundation, Stanford Digital Economy Lab and Tides Foundation for generous funding. We thank Jim Bessen, participants at the 2023 AEA Annual Meeting, and Emin Dinlersoz for valuable comments and feedback. The views expressed herein are those of the authors and do not necessarily reflect the views of the National Bureau of Economic Research.
The authors are grateful to the Hewlett Foundation, Kauffman Foundation, Markle Foundation, National Science Foundation, Stanford Digital Economy Lab, and Tides Foundation for generous funding.